What's New: July 2026
June was about giving your customers more to read — Docs, a Developer Portal, a public Roadmap. July is about what your team can do, and increasingly, what your team's AI agents can do alongside them.
StayUpfront now connects to Claude, ChatGPT, Cursor and VS Code as a proper, permissioned connector. Una drafts your support replies and — if you want — answers out of hours. Incidents run on a new engine that shows its working. And roles let you decide exactly who on your team can touch what.
New: Agents & MCP
Connect StayUpfront to the AI tools your team already uses, and let them actually drive the product rather than just read about it.
- One-click sign-in. Add StayUpfront as a custom connector in Claude, Claude Code, ChatGPT, Cursor or VS Code. You authorise it in the browser — there's no API key to generate, paste or rotate.
- Real work, not just lookups. An agent can open an incident, post updates, triage and reply to tickets, write Docs and API reference pages, manage your monitors and status-page components, and tell you who's on call.
- Your customers get it too. On your portal, your customers can connect their own agents to a much smaller surface: their own tickets, your published docs, the incidents they're allowed to see, and your roadmap. The connector introduces itself as your support desk, not as StayUpfront.
- It inherits your permissions, never more. An agent connected by a support agent can do exactly what that support agent can do. The tool list is trimmed per person — an owner sees far more than a viewer.
- Agents create and operate. They never destroy. There are no delete tools, deliberately. Removing something stays a human decision made in the app.
Staff find it under Agents & MCP in the account menu. Your customers find it on your portal.
New: The StayUpfront API
A public REST API at /api/v1 covering incidents, scheduled maintenance, docs, support tickets, roadmap, feature requests, changelog, customers, monitors, status-page components and on-call.
- Three ways in. A System key for whole-org automation, a personal token for a staff member (bounded by their role — a token can never out-privilege the person who made it), or a customer token scoped to your docs and their own tickets.
- Access ends when the relationship does. Remove a staff member and their tokens stop working. Archive a customer contact and theirs do too. No cleanup list to remember.
- Grown-up plumbing. Standard problem-detail errors, published rate limits, CORS, and a revocation kill switch.
New: Roles & permissions
Owners can now decide who does what, area by area.
- Five roles out of the box — Admin, Support Agent, Engineer, Member, Viewer. Rename them, edit them, or build your own.
- Permission ladders, not checkboxes. Each area of the product has levels. Support runs view, then respond, then manage, then delete. So you can give an engineer full visibility and let them join internal discussion without ever being able to reply to a customer.
- Some things stay with owners. Managing members, invitations, roles, API keys and connected apps can't be delegated.
Una drafts your replies
- A suggested reply on every triaged ticket, written from your own Docs, the customer's history, any open incidents, and what's known about their account.
- Review first, always. Read the draft, edit it, or send it as-is with one click. Nothing reaches a customer without someone choosing to send it.
- Low-confidence drafts try harder. A weak draft is automatically retried on a stronger model before it's shown to you.
- Out-of-hours answers, if you opt in. When you're closed, Una can send high-confidence drafts on your behalf — never for urgent or high-priority tickets, never during an active incident, and never more than once on the same ticket. The unlock has to be earned first, and you can switch it off at any time.
New: Customer facts
Short, curated truths about an account, kept where they're useful: "Pays annually — renewal lands on 1 March." "Jane (CTO) prefers phone."
- A Facts tab on the customer page, with the five newest previewed on Overview.
- Ticket triage reads them, so a new ticket arrives already understanding the account.
- Una writes them after a ticket resolves, clearly attributed, so what you learn on a Tuesday is still there in six months.
- Internal only. Facts never reach your portal, your customers, or any customer-facing API.
Notes and facts do different jobs and both stayed: notes are the running commentary, facts are the curated current state.
Support tickets: draft a reply together
- One draft per ticket, not one per person. Anyone who can respond can pick up a draft, edit it, and send it — the reply is attributed to whoever actually sends it. No more being locked out of a colleague's half-written answer.
- You can see who's writing. A banner on the ticket reads "Rob is working on a reply", live, with a Review it pill to open it.
- A proper review panel. The draft and a comments rail, side by side and full height, opened from either the writer's side or the reviewer's. Discuss the wording, then hand off with Edit draft.
- Nobody clobbers anybody. If a colleague saves while you're typing, you're told who — and your text is untouched. You choose: see their version, or keep yours. Neither of you loses work to a race.
- Send with intent. The send button now asks what should happen next: Send & wait for reply, Send & keep working (for a clarifier or a "still on it", so the ticket isn't parked or swept as customer-silent), or Send & resolve.
Support hours, and being honest about being closed
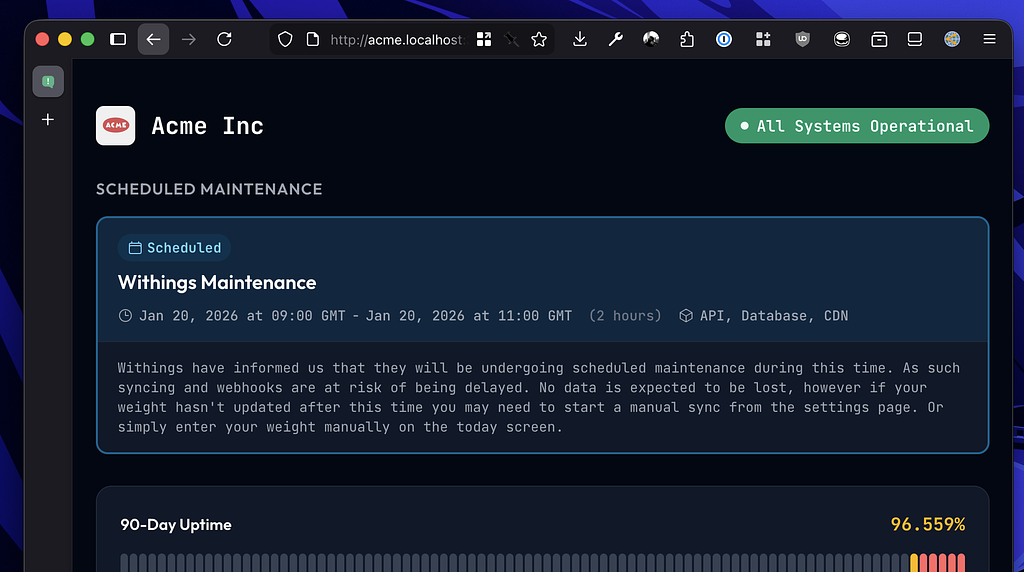
- Your hours now show on your portal — a live "Open now" or "Opens Monday at 09:00", with the full weekly schedule and upcoming closures beside the new-ticket form.
- Closed dates, one-off or annually recurring, for bank holidays and shutdowns. Manage them from the Business Hours settings card.
- Response clocks skip your closures, so a ticket that arrives on Christmas Day doesn't quietly burn its target.
If you run 24/7, none of this appears.
Reply by email
- Customers can just hit reply. A reply to a ticket email lands back on the ticket, reopens it, restarts the response clock and notifies whoever's on it.
- Email in a new ticket. Your customers can open a ticket by emailing an address — no portal sign-in required.
- Nothing to set up. Mail sends from a subdomain we own and verify, so there's no DNS work for you. Your customers see your organisation's name.
- Your emails wear your colours — org accent and company name, not ours.
Incidents: a new engine that shows its working
- Origin. Every incident now carries a panel telling you exactly what raised it, always — no more guessing whether a human or a monitor started this.
- Notified. A rail showing precisely who was alerted and how, drawn from the real alert log rather than reconstructed after the fact.
- Two honest toggles. Auto-attach and auto-resolve are yours to set, per monitor, rather than being buried behaviour.
- Pausing a monitor no longer resolves its incident. Silencing a noisy check shouldn't tell your customers the problem is fixed.
- Quick recurrences reopen. If something breaks again moments after you resolved it, the original incident reopens instead of a near-duplicate appearing.
- Recovery resolves. A heartbeat that starts pinging again closes its own incident.
Alerting
- Notifications is now Alerting, which is what everyone was calling it anyway.
- Escalation policies are first-class and reusable — build the ladder once, point many rules at it.
- Channels attach to alert rules. Attaching a channel is the opt-in, so there's no second toggle to forget.
- Somebody always gets it. Configure who to fall back to when nobody's covering the rota.
- SMS status updates on follow-ups, alongside email and your chat channels.
- DNS changes alert by default, with exclusions for the records you expect to move.
Slack, without building a Slack app
- Add to Slack, authorise, pick your channels. No creating your own app, no
xoxb-token to paste anywhere. - Replies sync back in seconds
- Acknowledge from Slack. Incident alerts carry an Acknowledge button; one click acknowledges in StayUpfront and pauses paging.
Monitoring
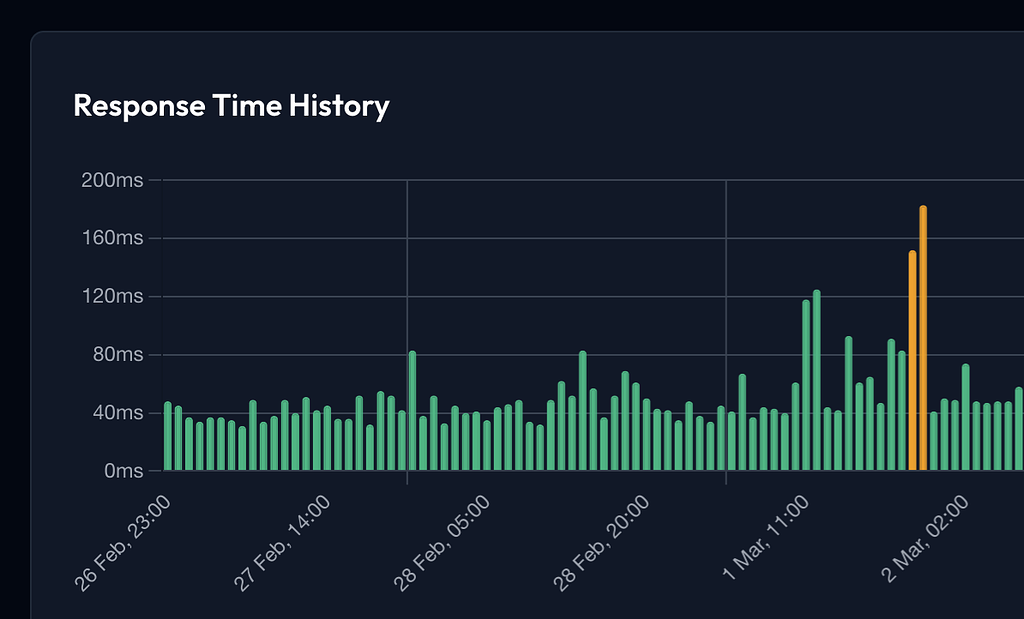
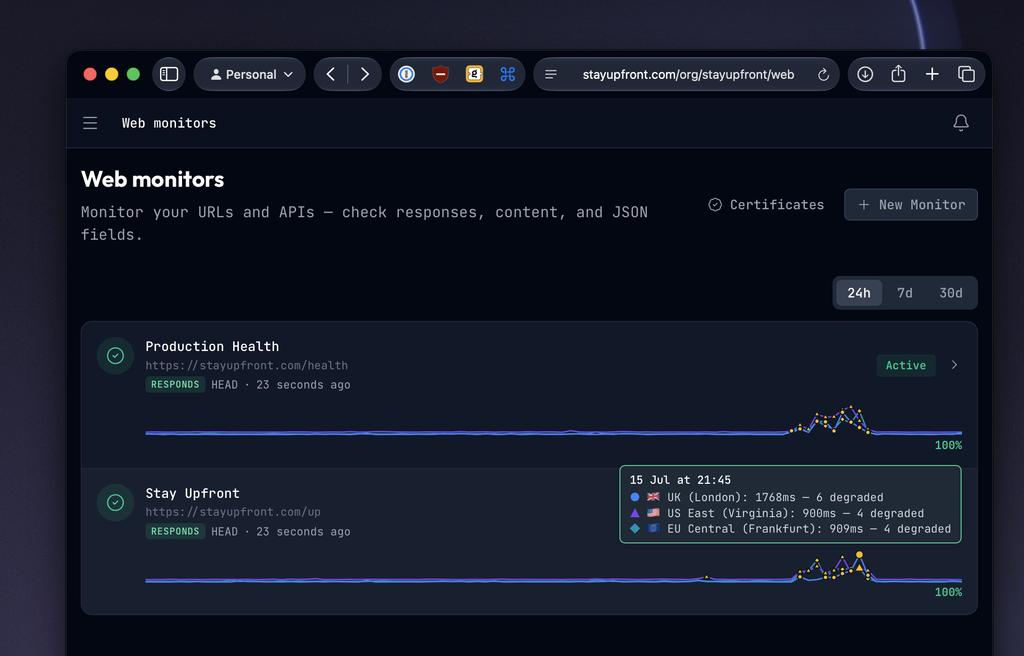
- Multi-region web checks. Probe a URL from up to three locations — UK (London), US East (Virginia) and EU Central (Frankfurt) — with a line per region on the chart, so you can tell "it's down" from "it's down from Frankfurt". Set how many regions must agree before a check counts as down.
- Better charts. Line charts throughout, a range switch on the index, and drag-to-select on any chart to zoom into the window you care about.
- Uptime checks are now Web checks, in the nav, the URLs and the copy.
- Uptime certificates log every view, with the full access history on the certificate.
Your status portal
- Component groups. Group components under a collapsible heading — a "Web Checks" group holding your UK, US and Europe regions, for example.
- Sharper incident visibility. Four clear levels plus visibility by tag, and the status page names the tags rather than shrugging "by tag".
- Per-item roadmap visibility, so a roadmap item can be public, customers-only, or held back.
- Subscribe, formerly Notifications — clearer about what following your status page actually does.
- Portal tickets grew up: search, Your/All tabs, a status filter, endless scrolling, and the ability to watch a ticket and see who's on it. Tickets belong to the organisation, not just the person who raised them, so colleagues can pick up where each other left off.
- Your sign-in emails wear your portal's colours, not ours.
Docs & Developers
Docs
- Type
/to cross-link another article, an incident or a changelog entry without leaving the editor. - A sticky table of contents in its own column, tracking where you are.
- "Was this helpful?" votes are tied to the version of the article they were cast against, so a rewrite doesn't inherit old complaints.
- Copy as Markdown, tag-level visibility, and drag-to-reorder categories.
Developers
- A rebuilt reference renderer, in-house — one endpoint at a time, real syntax highlighting, and fast even on very large specs.
- A visual builder with no YAML in sight, with live preview as you write.
- Try it inline, from the reference itself — for your staff, and for your customers on your portal, who can save their own tokens to send with.
- Spec versioning and an API changelog, so your customers can see what changed and when.
- Narrative guides alongside the reference, for the things an endpoint list can't explain.
- Code samples in multiple languages, plus export as OpenAPI, a Postman collection, or
llms.txtfor agents. - ⌘K to jump to any endpoint or schema.
- Agents can author Docs and API reference pages too, over the connector or the API.
New: a free launch checklist
A free tool at stayupfront.com/tools/launch-checklist. Enter a domain and get a graded report across DNS, email, TLS, HTTP behaviour and content — twelve automated checks with a one-line fix for each, plus the human-only items worth ticking off before you go live. Anonymous, no sign-up, nothing stored.
What's New: July 2026
June was about giving your customers more to read — Docs, a Developer Portal, a public Roadmap. July is about what your team can do, and increasingly, what your team's AI agents can do alongside them.
StayUpfront now connects to Claude, ChatGPT, Cursor and VS Code as a proper, permissioned connector. Una drafts your support replies and — if you want — answers out of hours. Incidents run on a new engine that shows its working. And roles let you decide exactly who on your team can touch what.
New: Agents & MCP
Connect StayUpfront to the AI tools your team already uses, and let them actually drive the product rather than just read about it.
- One-click sign-in. Add StayUpfront as a custom connector in Claude, Claude Code, ChatGPT, Cursor or VS Code. You authorise it in the browser — there's no API key to generate, paste or rotate.
- Real work, not just lookups. An agent can open an incident, post updates, triage and reply to tickets, write Docs and API reference pages, manage your monitors and status-page components, and tell you who's on call.
- Your customers get it too. On your portal, your customers can connect their own agents to a much smaller surface: their own tickets, your published docs, the incidents they're allowed to see, and your roadmap. The connector introduces itself as your support desk, not as StayUpfront.
- It inherits your permissions, never more. An agent connected by a support agent can do exactly what that support agent can do. The tool list is trimmed per person — an owner sees far more than a viewer.
- Agents create and operate. They never destroy. There are no delete tools, deliberately. Removing something stays a human decision made in the app.
Staff find it under Agents & MCP in the account menu. Your customers find it on your portal.
New: The StayUpfront API
A public REST API at /api/v1 covering incidents, scheduled maintenance, docs, support tickets, roadmap, feature requests, changelog, customers, monitors, status-page components and on-call.
- Three ways in. A System key for whole-org automation, a personal token for a staff member (bounded by their role — a token can never out-privilege the person who made it), or a customer token scoped to your docs and their own tickets.
- Access ends when the relationship does. Remove a staff member and their tokens stop working. Archive a customer contact and theirs do too. No cleanup list to remember.
- Grown-up plumbing. Standard problem-detail errors, published rate limits, CORS, and a revocation kill switch.
New: Roles & permissions
Owners can now decide who does what, area by area.
- Five roles out of the box — Admin, Support Agent, Engineer, Member, Viewer. Rename them, edit them, or build your own.
- Permission ladders, not checkboxes. Each area of the product has levels. Support runs view, then respond, then manage, then delete. So you can give an engineer full visibility and let them join internal discussion without ever being able to reply to a customer.
- Some things stay with owners. Managing members, invitations, roles, API keys and connected apps can't be delegated.
Una drafts your replies
- A suggested reply on every triaged ticket, written from your own Docs, the customer's history, any open incidents, and what's known about their account.
- Review first, always. Read the draft, edit it, or send it as-is with one click. Nothing reaches a customer without someone choosing to send it.
- Low-confidence drafts try harder. A weak draft is automatically retried on a stronger model before it's shown to you.
- Out-of-hours answers, if you opt in. When you're closed, Una can send high-confidence drafts on your behalf — never for urgent or high-priority tickets, never during an active incident, and never more than once on the same ticket. The unlock has to be earned first, and you can switch it off at any time.
New: Customer facts
Short, curated truths about an account, kept where they're useful: "Pays annually — renewal lands on 1 March." "Jane (CTO) prefers phone."
- A Facts tab on the customer page, with the five newest previewed on Overview.
- Ticket triage reads them, so a new ticket arrives already understanding the account.
- Una writes them after a ticket resolves, clearly attributed, so what you learn on a Tuesday is still there in six months.
- Internal only. Facts never reach your portal, your customers, or any customer-facing API.
Notes and facts do different jobs and both stayed: notes are the running commentary, facts are the curated current state.
Support tickets: draft a reply together
- One draft per ticket, not one per person. Anyone who can respond can pick up a draft, edit it, and send it — the reply is attributed to whoever actually sends it. No more being locked out of a colleague's half-written answer.
- You can see who's writing. A banner on the ticket reads "Rob is working on a reply", live, with a Review it pill to open it.
- A proper review panel. The draft and a comments rail, side by side and full height, opened from either the writer's side or the reviewer's. Discuss the wording, then hand off with Edit draft.
- Nobody clobbers anybody. If a colleague saves while you're typing, you're told who — and your text is untouched. You choose: see their version, or keep yours. Neither of you loses work to a race.
- Send with intent. The send button now asks what should happen next: Send & wait for reply, Send & keep working (for a clarifier or a "still on it", so the ticket isn't parked or swept as customer-silent), or Send & resolve.
Support hours, and being honest about being closed
- Your hours now show on your portal — a live "Open now" or "Opens Monday at 09:00", with the full weekly schedule and upcoming closures beside the new-ticket form.
- Closed dates, one-off or annually recurring, for bank holidays and shutdowns. Manage them from the Business Hours settings card.
- Response clocks skip your closures, so a ticket that arrives on Christmas Day doesn't quietly burn its target.
If you run 24/7, none of this appears.
Reply by email
- Customers can just hit reply. A reply to a ticket email lands back on the ticket, reopens it, restarts the response clock and notifies whoever's on it.
- Email in a new ticket. Your customers can open a ticket by emailing an address — no portal sign-in required.
- Nothing to set up. Mail sends from a subdomain we own and verify, so there's no DNS work for you. Your customers see your organisation's name.
- Your emails wear your colours — org accent and company name, not ours.
Incidents: a new engine that shows its working
- Origin. Every incident now carries a panel telling you exactly what raised it, always — no more guessing whether a human or a monitor started this.
- Notified. A rail showing precisely who was alerted and how, drawn from the real alert log rather than reconstructed after the fact.
- Two honest toggles. Auto-attach and auto-resolve are yours to set, per monitor, rather than being buried behaviour.
- Pausing a monitor no longer resolves its incident. Silencing a noisy check shouldn't tell your customers the problem is fixed.
- Quick recurrences reopen. If something breaks again moments after you resolved it, the original incident reopens instead of a near-duplicate appearing.
- Recovery resolves. A heartbeat that starts pinging again closes its own incident.
Alerting
- Notifications is now Alerting, which is what everyone was calling it anyway.
- Escalation policies are first-class and reusable — build the ladder once, point many rules at it.
- Channels attach to alert rules. Attaching a channel is the opt-in, so there's no second toggle to forget.
- Somebody always gets it. Configure who to fall back to when nobody's covering the rota.
- SMS status updates on follow-ups, alongside email and your chat channels.
- DNS changes alert by default, with exclusions for the records you expect to move.
Slack, without building a Slack app
- Add to Slack, authorise, pick your channels. No creating your own app, no
xoxb-token to paste anywhere. - Replies sync back in seconds
- Acknowledge from Slack. Incident alerts carry an Acknowledge button; one click acknowledges in StayUpfront and pauses paging.
Monitoring
- Multi-region web checks. Probe a URL from up to three locations — UK (London), US East (Virginia) and EU Central (Frankfurt) — with a line per region on the chart, so you can tell "it's down" from "it's down from Frankfurt". Set how many regions must agree before a check counts as down.
- Better charts. Line charts throughout, a range switch on the index, and drag-to-select on any chart to zoom into the window you care about.
- Uptime checks are now Web checks, in the nav, the URLs and the copy.
- Uptime certificates log every view, with the full access history on the certificate.
Your status portal
- Component groups. Group components under a collapsible heading — a "Web Checks" group holding your UK, US and Europe regions, for example.
- Sharper incident visibility. Four clear levels plus visibility by tag, and the status page names the tags rather than shrugging "by tag".
- Per-item roadmap visibility, so a roadmap item can be public, customers-only, or held back.
- Subscribe, formerly Notifications — clearer about what following your status page actually does.
- Portal tickets grew up: search, Your/All tabs, a status filter, endless scrolling, and the ability to watch a ticket and see who's on it. Tickets belong to the organisation, not just the person who raised them, so colleagues can pick up where each other left off.
- Your sign-in emails wear your portal's colours, not ours.
Docs & Developers
Docs
- Type
/to cross-link another article, an incident or a changelog entry without leaving the editor. - A sticky table of contents in its own column, tracking where you are.
- "Was this helpful?" votes are tied to the version of the article they were cast against, so a rewrite doesn't inherit old complaints.
- Copy as Markdown, tag-level visibility, and drag-to-reorder categories.
Developers
- A rebuilt reference renderer, in-house — one endpoint at a time, real syntax highlighting, and fast even on very large specs.
- A visual builder with no YAML in sight, with live preview as you write.
- Try it inline, from the reference itself — for your staff, and for your customers on your portal, who can save their own tokens to send with.
- Spec versioning and an API changelog, so your customers can see what changed and when.
- Narrative guides alongside the reference, for the things an endpoint list can't explain.
- Code samples in multiple languages, plus export as OpenAPI, a Postman collection, or
llms.txtfor agents. - ⌘K to jump to any endpoint or schema.
- Agents can author Docs and API reference pages too, over the connector or the API.
New: a free launch checklist
A free tool at stayupfront.com/tools/launch-checklist. Enter a domain and get a graded report across DNS, email, TLS, HTTP behaviour and content — twelve automated checks with a one-line fix for each, plus the human-only items worth ticking off before you go live. Anonymous, no sign-up, nothing stored.